
Which one is the most discussed attribute of technical analysis? Trading Level Support? Or Resistance? Well, without any hesitation, both of them are HOT CAKE.
Support and Resistance Forex Strategy is the basic notion that gives a hand to the traders to analyze, understand and act on chart patterns in the financial market. It is a simple mechanism to execute a quick analysis to ascertain some point of interest of traders. For instance:
To think simply, support is the point where the demand remains strong to keep the stock from falling, and resistance is the alternative. It stops the stock from moving higher.
Still, Confusing right?
Okay, let's make it more transparent through an example. Assume that “A price following the downward trend to $50 in the morning, and later in the day it goes down to $49.90 before rising. Then right before the end of the day, the price moves bounced up to $49.95 and moved further, closing at $51.
What can we see here? We can detect three support levels in total, forming a support area together. The Support area here would be $49.90 to $50. Similarly, the Resistance level also forms resistance areas just like the support.
For instance, if a stock goes up to $50 and then falls, it goes up to $50.10 and falls, and again it rises to $50.05 and again falls.
So it is understandable that the Resistance area here would be $50 to $50.10. Following the strategy, you must read the stock support and resistance levels.
Let's face it! These trading strategies can often be a REAL hassle since there are vast facts to consider and look out for.
To effectively use a support and resistance trading strategy, you must first understand how asset prices typically move so that you can interpret resistance from that framework.
You should also be aware that different types of support exist, such as minor and major/strong.
Minor levels are expected to be broken, whereas key levels are expected to hold and cause the price moves to drive in the opposite direction.
You have come to the point of understanding the basics of Support of Resistance. Now let's summarize them a bit to make them easy to catch.
Let's make a COMPARISON. No! No numbers or Statistics this early. Let's compare Support with the “Ceiling” of the house and Resistance with the “Floor.”
Now, How does this work?
To begin with, Support shows a low level of stocks reached over time. On the other hand, Resistance shows a high level of stocks reached over time.
Why are you here? To learn in-depth about Support and Resistance, of course. But why do you need that for?
You will know why!
We all know how massive the Forex Market is! As per BIS's Triennial Survey, trading support in the Forex market has reached more than $6.6 trillion daily! With more than 10 million active traders globally!
Yes, these numbers are enough to blow your mind. And the FUN FACT is that most traders are between 18-34 years old. Now let's see a distribution of average age groups of traders worldwide.
Source: tokenist.com
Almost 27% of forex traders start their trading career between 18 to 34 years old. An average of 28% of traders are in the age group of 35-44 years old.
But the number is still close to the other age groups when it is even 50+ years old! So it is NEVER TOO LATE to Start, But Always Better to START EARLY!
Yes, you got us right. You must always have proper and effective strategies to have a good kick at the beginning. This is why you are here and learning the Support and Resistance Trading Strategy.
In the financial markets, A trader needs to seek advice as well as apply strategies depending on the market situation and moves to execute a successful or short trade.
Strategies are meant to use to stand one step forward than others, as well as Forex trading support. The support and Resistance Strategy is a win-win Strategy if it can be applied properly! YES, you heard right!
The way to trade using support trading strategies are to buy at hand to support an upward trend or chart patterns where the prices climbed up. And to sell at hand to resist downward trends and patterns where prices are falling.
Now to grab all the facts easily, we will use a TRICK. We will separate “How to Trade Support and Resistance”- into two different ideas.
For instance:
Now, let's see what exactly they are!
Like the heading, one proper way of trading support and resistance level is just after the BOUNCE!
Most traders go through the same blunder. They set their orders on support and resistance levels. After that, they wait for their trade to materialize.
It is not like this method doesn't work at all. But what's the point of taking unnecessary risks when you know the most effective one, right?
On top of that, these trading ranges presume that a support or resistance level will detain except for the price drops.
Now you might be wondering, “I can be assured of the best price movement if I just fix an entry order on the line, So why am I not doing that?”
Well, while on the bounce, it's better to tilt all the Trading risks and odds in our favor. Also, finding some assurance which will be held by the strategy.
“Trading doesn't just reveal your character; it also builds it if you stay in the game long enough.”
Take this note seriously!
YES! There's a big reason behind it. Because you want to stay in the market for a long, that is why you are here. But how can you do that?
In Forex, we can take entry and exit whenever we want, depending on the price, hitting the resistance trading strategy and earning our desired amount of money.
But the matter of concern is, “These key levels often break.” So, solely depending on the bounce will be a foolish job to do!
So, to follow the break, we can run on two paths. For instance:
Let's start with the conventional way first.
Imagine a situation where you are dead-set on going on EUR/USD pair, and you are expecting it to rise right after bouncing from a support level. But your demo account balance seems to be falling slowly! Because you were holding on to a losing place soon after breaking the support. You are so stuck that you don't feel like taking help from your preferred forex broker.
Now you have TWO SITUATIONS coming your way.
Either say YES to the defeat, make your head out, terminate your position, or Continue your trade, hold on to your position, and hope for the price to rise again.
You will get acknowledged by all terms of this trading method if, only if you go with the second option.
Can you remember one thing? You grab the other side of the trade forex whenever you finish a position.
Closing out your EUR/USD trade at a breakeven point has a meaning. Can you guess it? It means you have to short the EUR/USD long trade, keeping the amount the same.
Again, the price will fall if enough selling and losing positions are terminated at the broken support level.
This is the foremost logic why a broken support level turns to a resistance level when it breaks!
All you need to do is to have PATIENCE, to take proper advantage of this situation.
We are not DONE YET! Expert says, without entering on the break, it is better to hold for the price to create a pullback to the broken support or resistance level and to enter just after the price bounces! In the end, you must stick with a resistance trading strategy.
As the name suggests, this is called the aggressive way, yet the simplest. The simplest way to try the breakouts is buying and selling each time the price passes through the zone of support strategy.
See, wasn't that aggressive, right?
The main thing to pay heed to is the TIME TO ENTER. And the best time is when the price passes through the significant support or the resistance zone. By following the strategy, you need to define support and resistance indicator to identify the possible trends.
The trading strategy is foregrounded using angled and horizontal lines known as “trendlines.”
And trendlines are classified into three main types. For instance:
If you are still suffering from not understanding, look at this picture, and I assure you that it will make your work 80% DONE!
By these categories, you can quickly figure out the market state. You can also have an average idea of the flow and move of the market.
Isn't that great?
We already know how powerful the support and resistance strategy is in the technical analysis of online trading. And to execute a successful trade, you can also use Trendlines as a strategy.
You need to know how to draw a resistance zone for better results. Here is how you can do it!
Resistance levels are created when a market follows the upward trend because the price action signals to move back after slowing down and going towards the trendline.
Oh wait, there's more!
The price makes higher moves in the upward trend. Just like that, the price makes lower moves in the downward trend.
Now, if you bridge the highs and the lows while the trend, you can gather an idea about the price, which may look for support or resistance zone.
These lines may look simple but can be your lifesaver, too, because the entry points and exit points are our trends, charts, and ranges.
And undoubtedly, these things help traders to move at an extra pace compared to others by providing ideas about the market condition.
.png)
Well, it will be better to start with an example, or you might face some complexity, and WE Don't WANT THAT!
Let's say the price is following the lower trend, and we can already assume that it will make a low and bounce again, and after that, it will fall again.
Now that low can be claimed as a minor support area, as the price didn't bounce off that level.
But as the trend is down, the price is also expected to go down through the minor support level.
What do you see in the above example?
The downtrend will still remain solid if the price falls below the minor support level. But what will be the scenario if the price holds and bounces near the former low? Yes, the range could be developing.
But what is the Major Support level? Did we just MISS IT? NO!
For currency pairs, the Support level is a key point. Expert traders often complete their potential trades at the support levels with the price action signal.
It is also said that the support level is profitable compared to the other levels if considered. But it is not a must for you to use it.
However, you have an option to forge your trading skills depending on simple indicators reading. But keep a note in your mind. “Don't make things complex.”
Making everything complex can ruin your whole trading style and help you make bad and wrong decisions!
I hope you may find the major and minor support and resistance levels in the forex strategy.
Now it's to rewind our sense to where we compared “Support” as the Floor and “Resistance” as the ceiling.
But now, it's time to add one more thing to your imaginary list. A bouncing “Rubber Ball” as the Security.
This will bounce on the floor (Support) and reach the ceiling (resistance). And the ball bouncing, can you guess what to compare it with?
Perhaps you are right or maybe wrong. Okay, no more suspense. It can be compared with the trading instrument that faces a price combination between the support and resistance zones.
Now let's add something more to the imagination.
Assume that the ball has gained double its weight while in the air, and if applied, it will thrust the ball between the resistance level.
Again, it will thrust the ball between the support level and pin bar while on the way down.
From both ways, it could be enthusiasm or the extra force; from the bulls or the bears, it has a break between support trading.
Now you can identify the significant zones in support and resistance levels.
You can see this from horizontal SR (the area is fixed). Eventually, it changes and is called dynamic support & resistance zone.
Three methods can now identify support DynamicSR. I have the right answer for this... I used 50 MA for identifying dynamic SR.
But it is not the best option to go. It's possible to use 500 MA, and it's good for your needs. You must find what works for you in a way that suits you.
Trendlines This is a horizontal line to identify support dynamic SRs from your chart. Also, you might often encounter Close dialog Session expired circumstances.
We're already familiar with the role of S&R lines, which are to be called zone based. It means that support & resistance zone cannot be defined in one line.
This way, professional trader can know, and all traders on Earth would receive entry orders at this price.
It is a zone that could be crossed or entered at a certain place. The trend could push prices to the downside; maybe price action signals will finally break them down.
So this point is described as a zone. The main objective of this trading strategy is to identify these zones to help us and to provide a great trading entry point.
Thousands of traders start daily their Forex online trading adventures. Those novice traders will profit target from the huge volatility of the daily trade volumes of $5 trillion.
Forex traders have made bold moves on new and trending markets and are required to trade with a thorough understanding of the market.
As per an independent financial advisor, The stock market plays a very good part; you need to understand the movements underlying this pair.
Then you can sell rather than trade purely from a gut feeling. A key kind of analysis is technical analysis.
What are called false breakouts? Have you ever faced it?
The answer is, Yes, you did. But you were not acquainted with the term.
Let's make it clear.
We know that the asset price support mostly jumps slightly and beyond our expectations. But this is not a regular thing that happens.
But whenever it does, it is titled a “False Breakout”.
But the blue sky of the breakout is an excellent trading opportunity. The best use of a breakout is to step into the market right after a faulty breakout trade.
For instance, if you see the trend going upward and the price is drawing back to support, then hold on and let the prize draw below the strong support and BOOM!
That's the time to buy, especially when it climbs back above the support.
Likewise, hold yourself and let the price break the resistance zone when the trend goes downward. After that, you can rely on short-sell when the price hits below the resistance zone.
But like everything else, “Fake Breakout” also has a DRAWBACK. And that will not always take place.
And the one mistake a novice trader makes is waiting for the opportunity to come and grab.
There remains a high chance of missing other good opportunities for the trading day.
That is why it is best to grab the day trading opportunities whenever they come.
More Reads from the Same Author
What's A Spread & Bid-Offer Spread?
Is Forex Trading Legal In India?
Starting with a Tip here.
Support and Resistance Forex's trading strategy is kind of vigorous, so if you want to follow it then your trading style will also have to be more energetic.
Another tip regarding the Support and Resistance Forex trading strategy is, that while following the upward trend, the last two things, the last high and the last low are vital.
Because if the price is lower then it would specify the possible change of the trend.
This is why concentrating on the support and resistance levels is what matters the most. And in strong areas, trends mostly face issues.
But from multiple attempts, it can be broken through, but it will consume time.
Point out the major support and resistance level of the chart, because they can be the same again if the price catches up in the same area.
Your next step will be to delete them once they are no longer the same.
For example, prices can move in a good way beyond the support and resistance zone if the price breaks between them.
Starting with a Tip here...
This particular Forex's trading strategy is vigorous, so if you want to follow it, your trading style will also have to be more energetic.
Another tip regarding Support and Resistance levels is that while following the upward trend, the last two things, the last high and the last low, are vital.
Because if the price is lower, then it would specify the possible trend change.
This is why concentrating on the support and resistance levels matters most. And in strong areas, trends mostly face issues.
But from multiple attempts, it can be broken through, but it will consume time.
Point out the chart's support and resistance levels because they can be the same again if the price action catches up in the same area.
Your next step will be to delete them once they are no longer the same. For example, prices can move well beyond the support and resistance levels if the price levels breaks between them.
What are the best Forex support/resistance trading strategies? It's your place. In all markets, the support level is crucial.
Forex support is similar to that found in stocks. How do we find the right support for the project? How does it affect our ability?
Market participants set support and resistance levels, which are representations of supply and demand or the order flows that change quickly.
This is a Forex support or resistance strategy based on the levels of support or resistance determined by the Pivot point technical indicator if the support or resistance reaches an equilibrium. Past performance does not necessarily indicate definite performance.
As for trading tips, here is a collection of support and resistance indicator tips and tricks that professional traders highly test and recommend.
The tips cover everything from where to draw the lines to how to confirm them and trade support while deriving some targets. Therefore, without any further ado, let's dive right in!
The time frame is important in this strategy. Longer-term support will be stronger than both short-term support and resistance indicator.
To avoid false signals, you must understand where these lines fall in higher time frames than what you are trading.
If we try to set an example, a resistance line drawn from a weekly price levels chart will almost certainly provide.
Enough resistance to negate a signal drawn from a daily or hourly price levels chart.
To avoid this, draw lines on weekly charts in one color, daily lines in another, and hourly lines in another, allowing you to determine which lines are more likely to affect your trade support process.
Theoretically, support and resistance lines are mostly known as one cognitive (which consumes quite a lot of time) technical analysis and signal generators.
These lines, once drawn, can provide target areas where signals can be found in the future.
Lines I've drawn during previous reversals, continuations, and breakouts have always impacted price action when it returns to that level.
This represents the underlying concept of why exactly the support and resistance lines work quite fluently.
These lines signify price levels where there was a Forex lot of buying or selling, where it reversed, or where it consolidated.
So, you get the IDEA, right?
When price action moves past this turning point, the market is divided into losers and winners. When price action returns to its previous level, losers will want to exit, while winners will want to enter.
Price action gaps, also known as windows, are areas on the chart where price action moves so quickly that there is a gap between one day or one candle and the next.
And... frankly, all of these can be caused by either good or bad news, but it always presents the same trading opportunities. First, gaps and windows offer substantial support.
This is usually due to the market moving so quickly that many traders were left out. As prices return to the gap level, professional traders who missed out on the previous move will scramble to get in on the next one.
Now, on the exit points, the gaps can be divided into two segments, also known as S/R levels.
While an uptrend occurs, the upper portion will act as support; nevertheless, if it is broken, the lower portion will turn into resistance.
It holds for downtrends as well. Most price level will eventually close; when they have widened, they will retrace to their initial level, which is something you should keep your eyes on!
Finding support and resistance levels and validating a support or resistance level are both easy tasks with the aid of Fibonacci retracements.
You can also estimate subsequent price action based on whatever retracement level is closest to or coincident with your support or resistance line.
A typical acquaintance is that broken support and resistance will naturally reverse.
This implies that a recognized resistance level will become support if price action rises and breaks past it.
You can anticipate buyers entering the market after price level to the breakout level. Why is that so?
Consider it this way, resistance exists because a sizable portion of the market wants to sell, and the breakout happens because buyers eventually outnumber sellers.
Price approaches this point can change quickly, excluding many potential buyers from the market and making it difficult for sellers to exit at a price level of their choosing.
Prices retracing to the breakout level offer a second opportunity to sell for those on the wrong side of the line and a second chance to buy for those on the right.
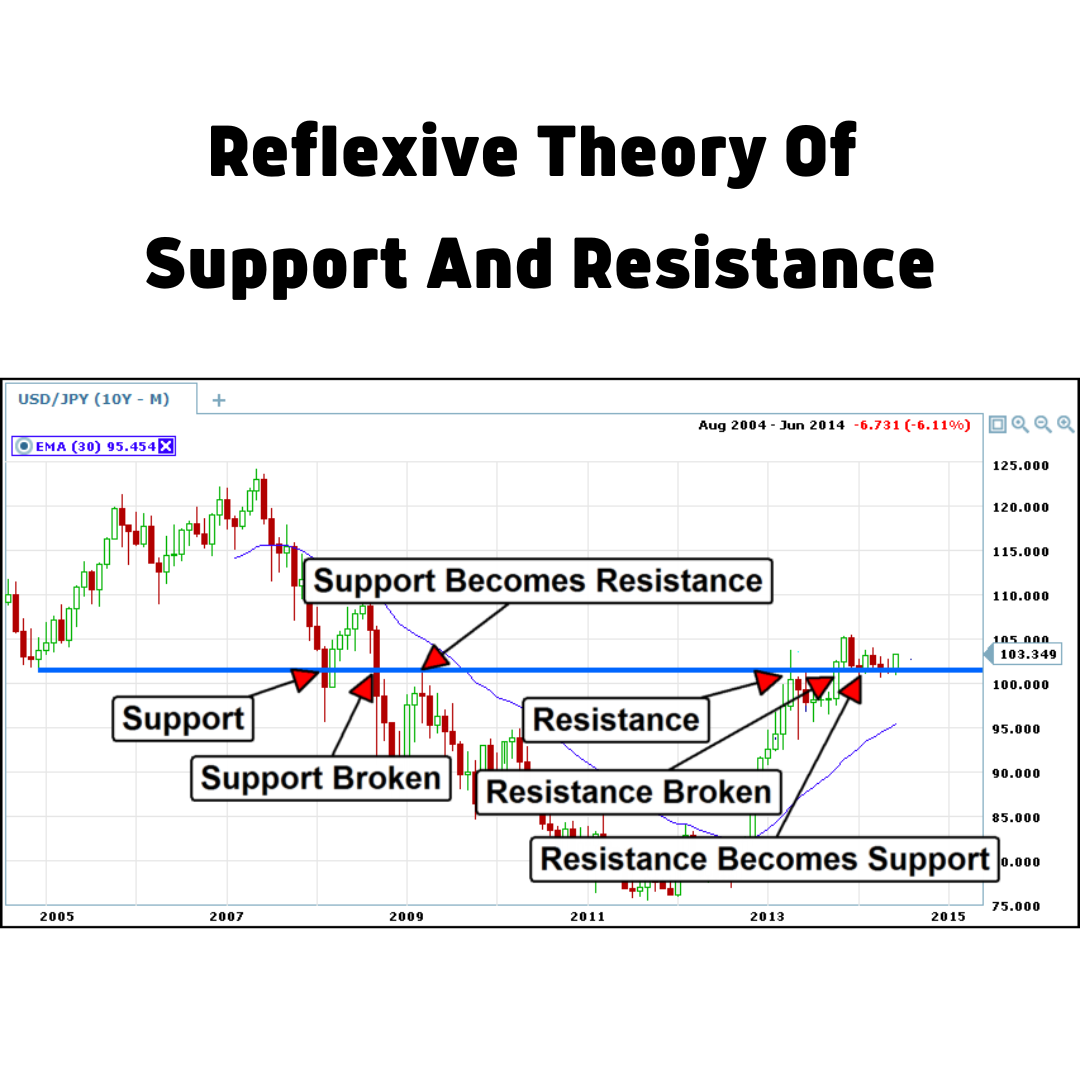
Examine the graph below; it is the same graph as the one above but with different annotations.
Take a look at how support was held in 2008 before breaking and providing the opposition in 2009.
See how price breaks in 2013 were restrained as they neared the same resistance line. Watch how, in 2014, that line was broken and turned into support.
.png)
Q1: Does support and resistance work in forex?
A: Thus, to utilize these lines taking a gander at the specific price, almost certainly, you will not obtain any outcome. The regions around support and resistance levels can create a result, and experience instructed me that this impact is by and large more grounded when costs show up from a long way away.
Q: Which time frame is best for support and resistance?
A: They are most valuable in moving business sectors and can be utilized on all tradable monetary instruments, including stocks and indices. The most well-known time frames are 10, 20, 50, 100, and 200-period moving averages. The more extended the time frame, the more prominent its likely importance.
Q: What happens when support and resistance lines meet?
A: Whenever support and resistance lines cross, they can interface with a trend and cause it to break out another way. These are called confluence areas. These can assist you with expecting breakouts from the fundamental pattern.
Q: How do you find the best support and resistance level?
A: Support is a price tag underneath the ongoing business sector value that show purchasing interest. Resistance is a cost over the ongoing business sector value that demonstrate selling interest. S&R can be utilized to recognize focuses for the trade. For a long trade, search for the quick resistance level as the objective.
Q: Where do you put your stop loss?
A: One ought to by and large place a stop loss in trading at the low of the latest candlestick when they are purchasing the stock. Additionally, one ought to stop trading at the high of the latest candlestick when they are selling the stock.
Q: Why does resistance turn into support?
A: The break of support flags that the powers of supply have beaten the powers of interest. Thusly, on the off chance that the price gets back to this level, there is probably going to be an expansion in supply and subsequently resistance. The other transformation of the coin is resistance transforming into support.
As everything about support and resistance have become thinner for you, now it’s high time to go through some strategies related to support and resistance.
So let’s jump down!
Oh, you are at the end. Yes, I promise you are. It didn’t feel, right? Well now that you have learned the ins and outs of Support and Resistance Forex Trading Strategy, I am pretty much sure that you will BREAK A LEG.
Oops sorry, it was my CAPS LOCK.
I hope you are not bothered learning all the key stuff because YOU are a learner and A Learner is the Gainer!
Happy Trading all the way! Learn more

